Unparalleled.Genomics.Solutions.
Genomics · Drug Discovery · Commercial Intelligence · MCP-native
Biomedical Entities
Companies
Genes
Pathways
Ontology Terms
Features
One graph, every layer of biology and business, in a single system.
Genomic Analysis
Upload genetic data, detect variants, and get genotype-aware health insights.
Biomarker Tracking
Track health metrics over time from wearables, labs, and manual entry with unit standardization.
Drug Discovery
Manage therapeutic assets across small molecules, biologics, peptides, and oligonucleotides.
Knowledge Graph
Drug-target mechanisms, bioactivities, and therapeutic efficacies linked to evidence sources.
LIMS Integration
Subject management, biospecimen tracking, assay protocols, and quantitative readouts.
Commercial Intelligence
Company deep dives, M&A and licensing deals, patents, revenue lines, and the patent-cliff math.
Development Pipelines
Monitor drug development stages, market organizations, and technology platforms.
Personalized Recommendations
Evidence-backed treatment suggestions based on your genomic profile and biomarker data.
How It Works
Four steps: focus, traverse, ground, decide.
Choose Your Focus
Select a therapeutic area, company, gene target, or ask a question in plain English.
Traverse the Graph
AI navigates 233,000+ biomedical entities: genes, proteins, drugs, trials, patents, companies and revenue, all linked by evidence.
Get Grounded Answers
Every claim traceable to PubMed, ClinicalTrials.gov, DrugBank, and patent databases. Zero hallucination.
Make Decisions
Investment thesis validation, competitive and patent-cliff analysis, drug repurposing, and personalized health insights.
One platform. Three ways in.
Biotech teams, investors, and researchers ask the same graph different questions.
Biotech Company
Pipeline IntelligenceDeep dive your competitors' pipeline. Map drug targets, track clinical trials, monitor patent filings across therapeutic areas.
“Which companies target EGFR in NSCLC?”
Osimertinib (AstraZeneca, Phase IV) → Dacomitinib (Pfizer, Phase IV) → 12 patents filed in 2024
Investor / VC
Market IntelligenceAsk any question about biotech. Get grounded answers with source citations from PubMed, ClinicalTrials.gov, and patent databases.
“What's the GLP-1 competitive landscape?”
Novo Nordisk (Semaglutide) → Eli Lilly (Tirzepatide) → 50+ active trials → $50B+ projected market
Researcher / Doctor
Scientific DiscoveryExplore genetic correlations, drug repurposing opportunities, and biological pathway interactions backed by evidence.
“What variants are associated with Alzheimer's risk?”
APOE ε4 (rs429358, 3.7x risk) → APP A673T (protective) → mTOR / Autophagy pathway connections
Biomedical Intelligence
Not a chatbot. A deterministic query engine over a curated biomedical knowledge graph.
Grounded Answers
Every answer traceable to graph nodes. If it's not in the database with a clear source, the AI cannot invent it. Zero hallucination on data.
7 Query Tools
Company portfolios, drug discovery paths, competitive landscapes, entity networks, pathway exploration, literature search, and variant analysis.
Source Attribution
Every claim linked to PubMed papers, ClinicalTrials.gov entries, or patent filings with confidence scores. Auditable by design.
From pipeline to patent cliff
The market layer of the graph: companies, deals, patents, revenue, and the loss-of-exclusivity math, on the same data as the biology.
Company Deep Dive
Portfolio, pipeline, patents, deals, reconciled revenue lines, and technology platforms, subsidiaries linked.
Patent Cliff & Exclusivity
Patent term, extensions, pediatric, orphan, and IRA folded into one loss-of-exclusivity date, tied to revenue at risk.
Deals & Licensing
M&A and licensing as structured rows: upfront, milestones, royalty, equity, territory, and rationale.
Revenue & Valuation
Per-line annual-report revenue reconciled to the total, with peak-sales forecasts and valuation inputs.
Market Sizing
Total addressable market, growth rate, and patient population per indication, per country, per year.
Catalyst Calendar
Conferences, R&D days, and trial readouts where deal flow clusters, linked to companies and assets.
NCTV-101 · exclusivity runway
LOE 2037Revenue at risk at LOE
$325M peak sales
The consolidation, at a fraction of the price
Query the graph from your AI tools
Connect the Nexotype MCP server and ask the knowledge graph in plain English, from any client.
Claude Desktop
Anthropic's desktop app for macOS & Windows
VS Code / Cursor
IDE extensions with MCP support
Claude Code / CLI
Terminal-based AI coding assistants
Connect remotely with zero install. Paste the URL in your client:
https://mcp.nexotype.com/mcpFrom your genome to a grounded insight
Upload genetic data, detect variants, and traverse from a mutation to the drug that might treat it.
Variant → Gene → Drug → Trial
One traversal, from mutation to medicine.
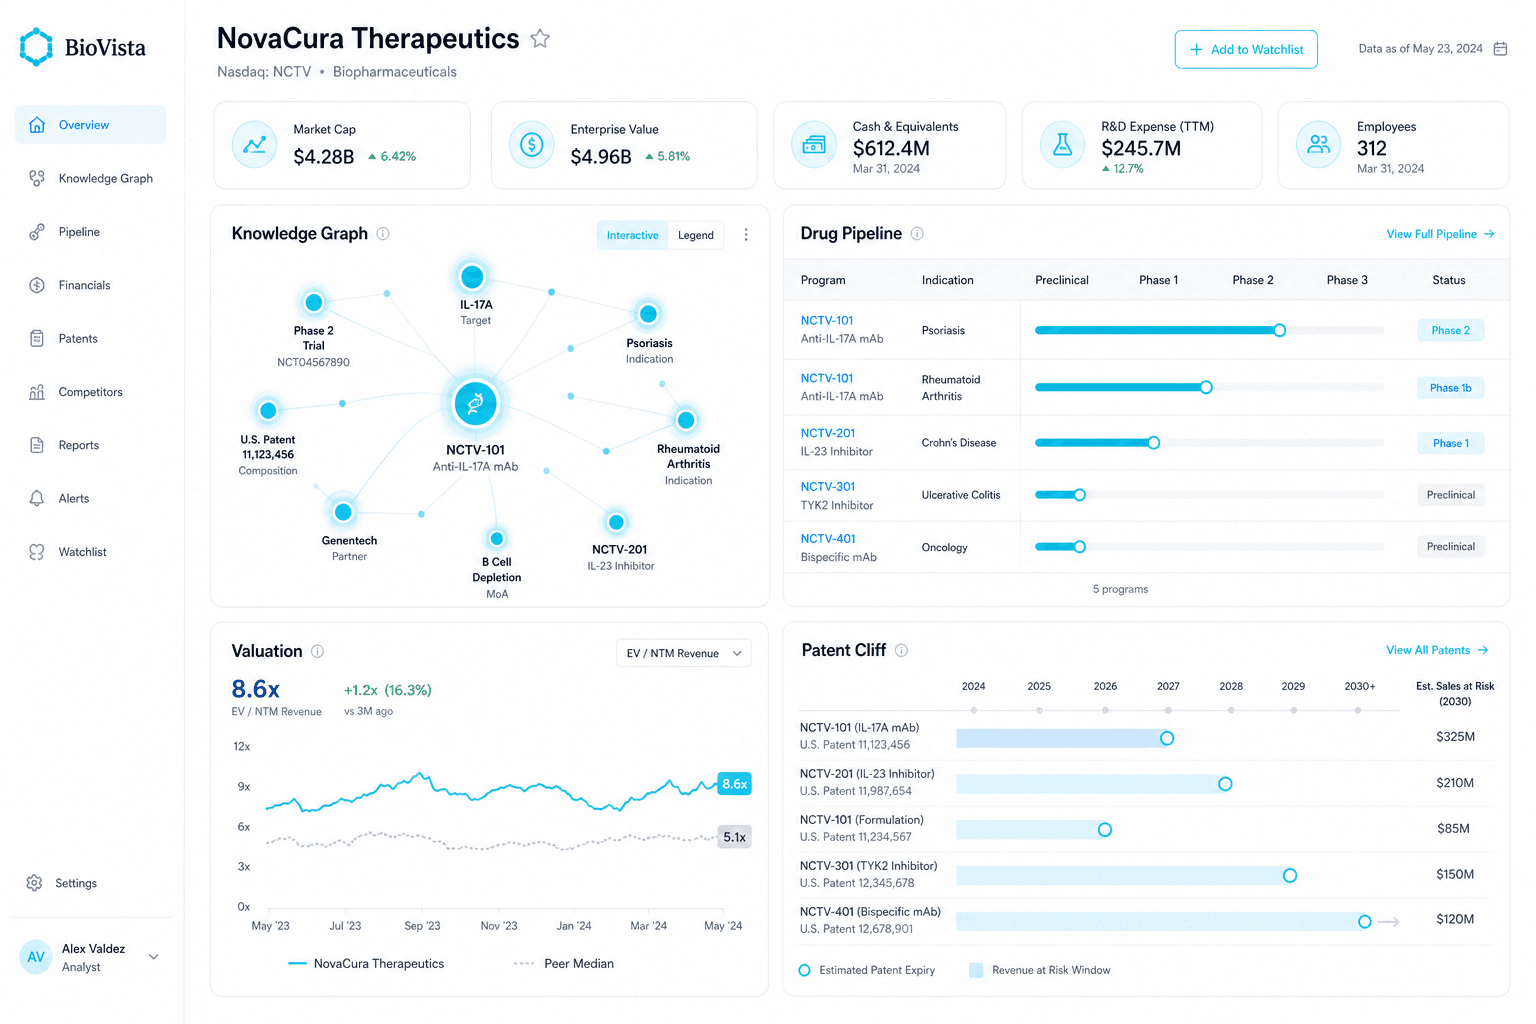
A whole company, in one view
Knowledge graph, drug pipeline, valuation and patent cliff on one screen, each figure traced back to its source.
Every plan reads the whole graph
Pick the volume you need, not the data you're allowed to see.
Base
The whole graph, for one person.
- 10 company reports/month
- 1 subject tracked
- 8,000 requests/month (max 500/day)
- Knowledge graph and commercial intelligence
- MCP server (Claude Desktop, Cursor)
- Upload genetic data (23andMe, WGS)
- Write your own R&D data
Pro
Screen at volume and bring your own data.
- 50 company reports/month
- 5 subjects tracked
- 100,000 requests/month (max 6,000/day)
- Everything in Base
- Write access (omics, clinical, LIMS, graph)
- Knowledge graph curation
- Priority email support
Enterprise
For teams covering a whole therapeutic area.
- 200 company reports/month
- 25 subjects tracked
- 500,000 requests/month (max 25,000/day)
- Everything in Pro
- Bulk data export
- Priority support (SLA-backed)
- Dedicated account manager
Need more than 200 reports a month? Talk to us.
Let's talk
Interested in sharing your ideas with us? Reach out and we'll get back to you.
Studio
52 Grigore Alexandrescu Street, Bucharest